


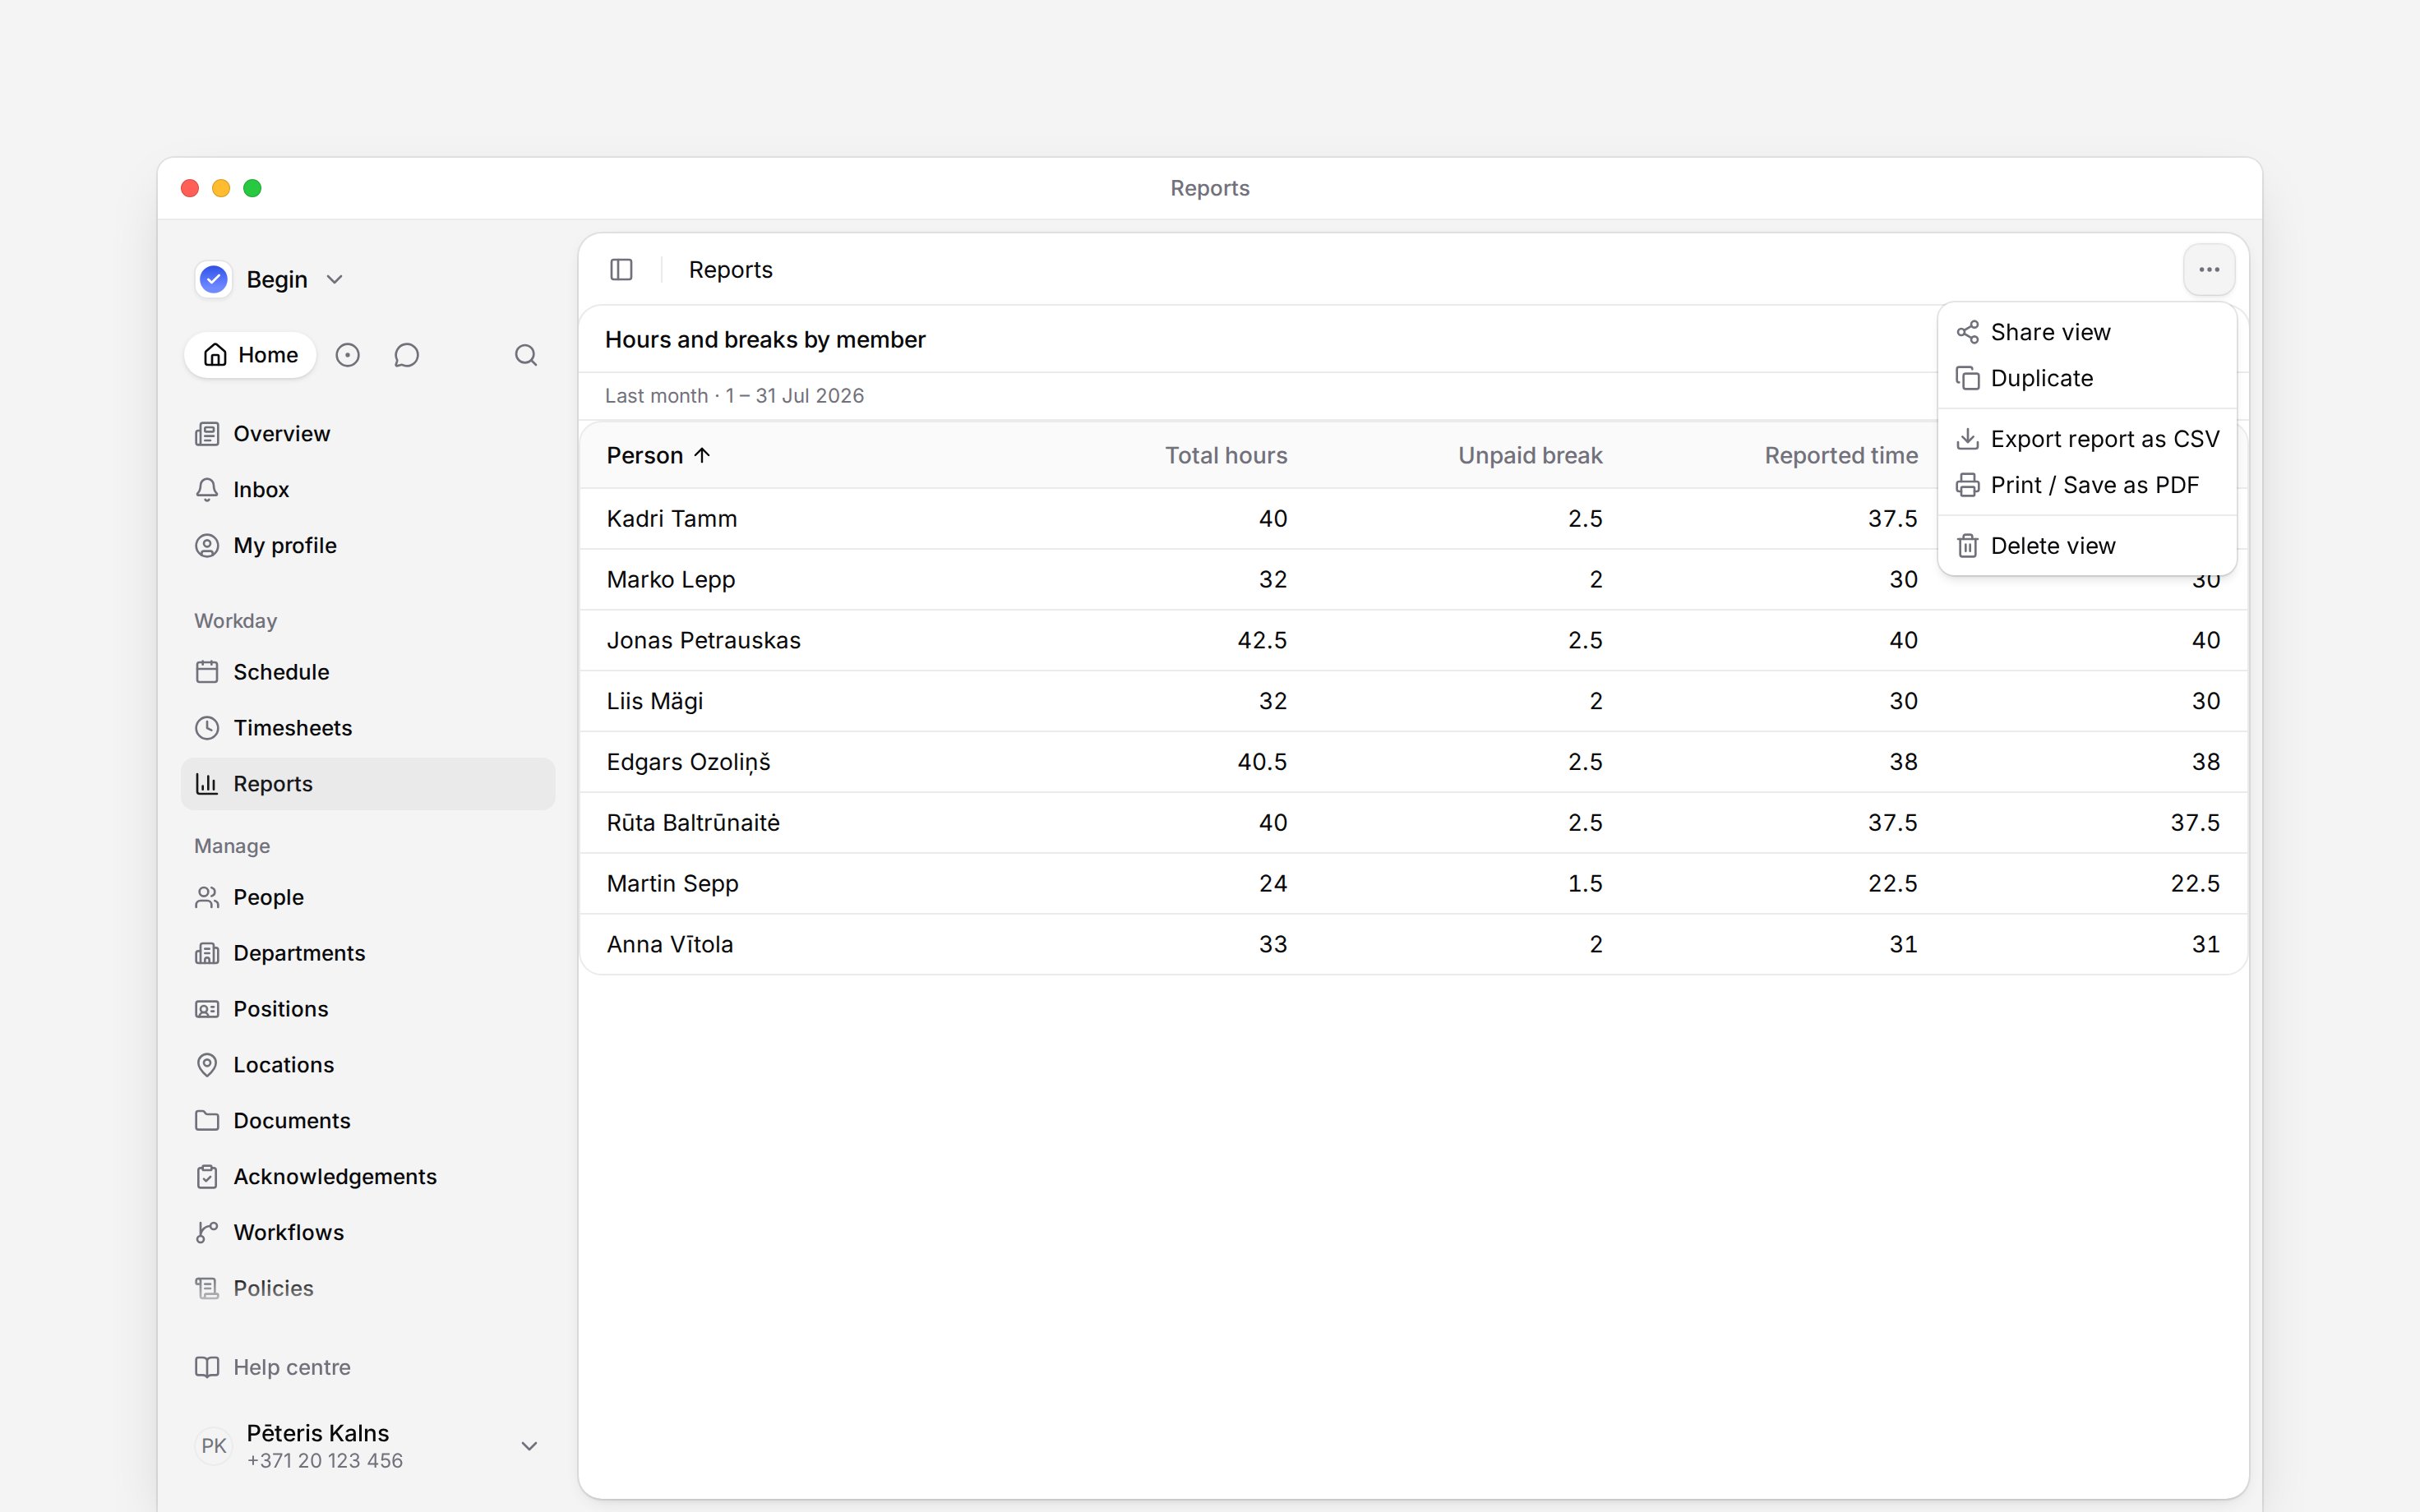
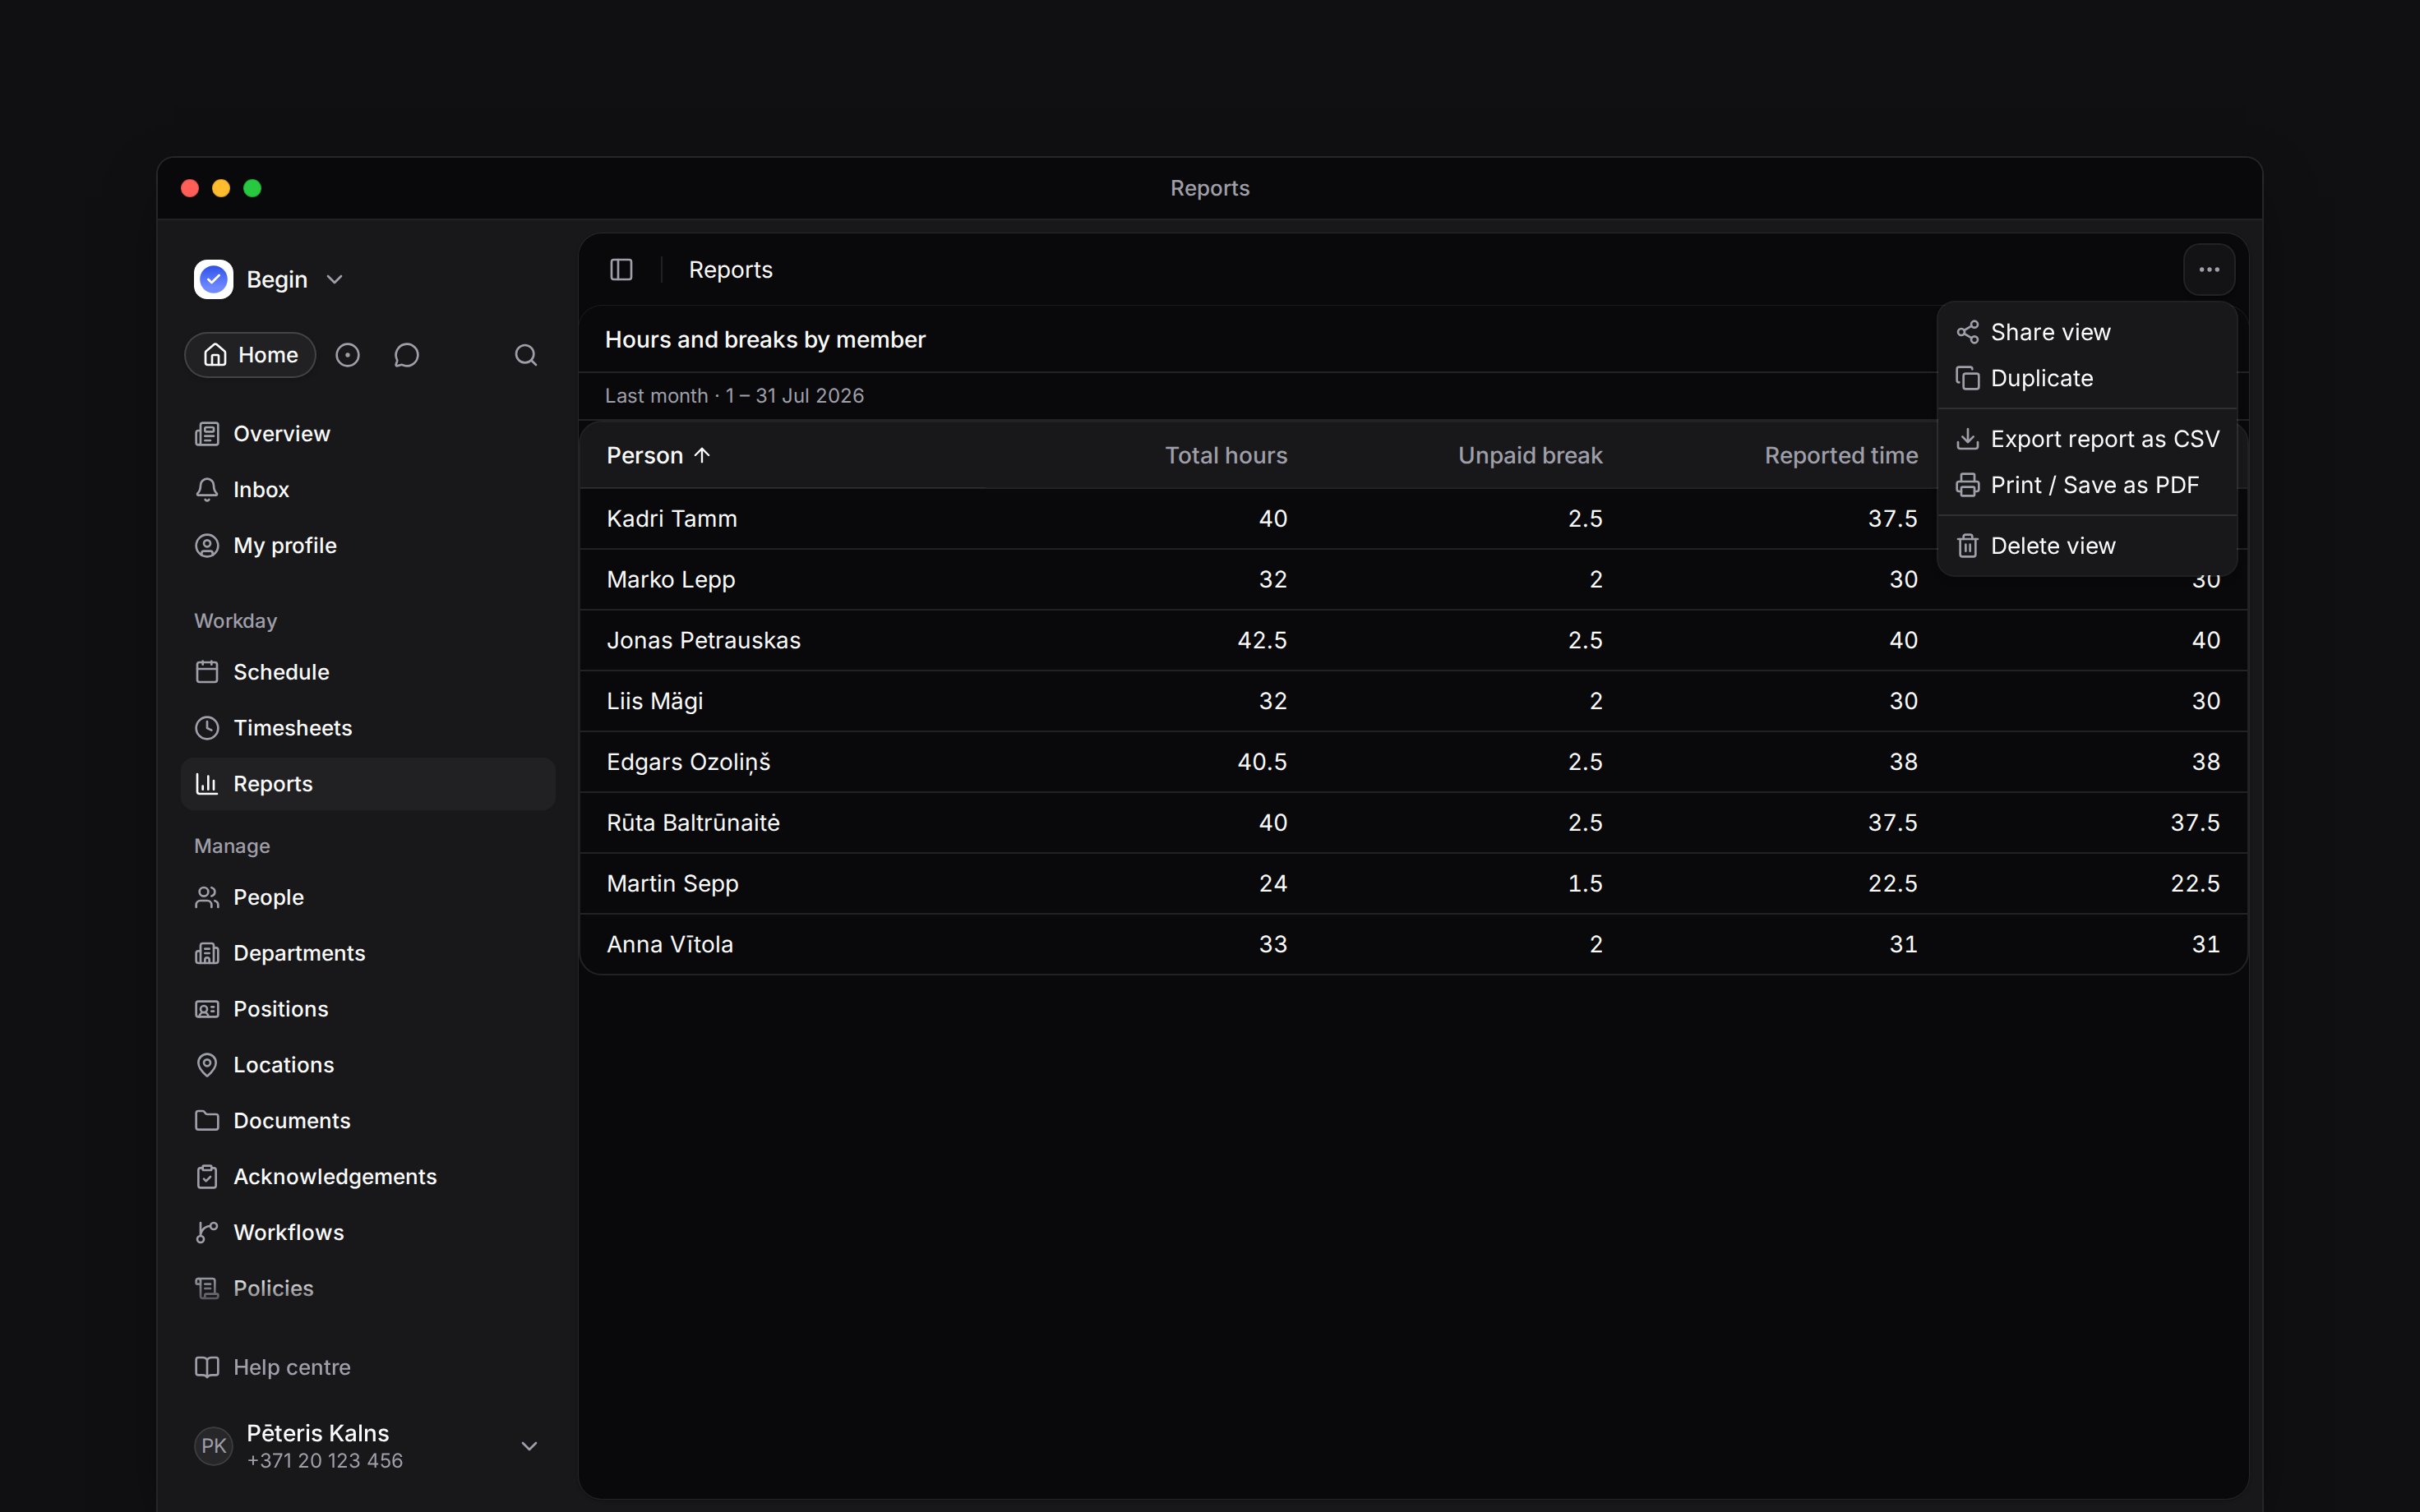
 Download a report as CSV to use its figures in a spreadsheet, or choose Print / Save as PDF for a printable copy. Check the report’s period, filters and current breakdown first: those choices determine what you take out. That includes filters you set for yourself on a report you cannot edit.
A period such as This month is worked out when you open the report, and every download and print covers that same period. A report opened on 30 September and exported just after midnight still holds September, as the screen does. Reload the report to move it on. Export report as Excel asks you to reload a report left open for more than a week.
Download a report as CSV to use its figures in a spreadsheet, or choose Print / Save as PDF for a printable copy. Check the report’s period, filters and current breakdown first: those choices determine what you take out. That includes filters you set for yourself on a report you cannot edit.
A period such as This month is worked out when you open the report, and every download and print covers that same period. A report opened on 30 September and exported just after midnight still holds September, as the screen does. Reload the report to move it on. Export report as Excel asks you to reload a report left open for more than a week.
Choose the format and download
1
Set the duration format
For spreadsheet calculations, choose Duration format → Decimal (9.25) in the report’s
display settings. Changing this saved setting needs edit access.
2
Open the report menu
Choose Export report as CSV.
3
Check the file
Confirm the period and columns before using the figures.
2026-08-21 and 2026-08-21 14:05 in every language, so a spreadsheet can sort and filter them. A chart is written as rows in the order it draws them, its first column named for what the chart counts by. A chart with a breakdown writes the series in a column of its own, a month is written as its year and month (2026-07), a week or day as the date it starts on, and a number or pie chart ends with its total. Export report as CSV is the immediate download; XLSX comes from Export report as Excel below.
Every file is named for the report as you see it and the period it covers, for example hours-by-member-2026-08-01_2026-08-31.csv. With one week or day of a report opened, the file is named for that week or day. Figures are rounded to two decimals, as on screen, and a negative number carries a plain minus sign, so a spreadsheet reads it as a number in every language. A unit the table shows beside a figure moves into the file’s column heading, for example Workload (%) or Paid time (h) with decimal hours, so each cell holds a plain number a spreadsheet can add. In a CSV, a cell starting with =, +, - or @ that is not a number starts with an apostrophe, so a spreadsheet shows it as text rather than running it. A report printed while Begin is in dark mode prints dark text on white paper, with the chart colours kept.
Export a report as Excel
Export report as Excel in the report menu builds an XLSX in the background and downloads it when the run finishes: the file arrives without a second click, and a report too large for the immediate download can still be taken out this way. Each chart comes along as data, on its own tab: the same rows Export report as CSV writes for it. If you open the XLSX in Numbers, a duration over 24 hours may appear as days and hours:25:00 can appear as 1:1. The value still adds correctly. To show total hours, select the duration cells, then choose Format → Cell → Duration → Custom Units and select Hours and Minutes. Numbers may omit the XLSX filters and repeated print headers. Set Format → Table → Headers & Footer to one header row, add filters under Organise → Filter, and select Repeat table headers in File → Print if you need them there.
You can open other pages while the file builds: it downloads wherever you are in Begin. If you switch to another workspace, it downloads when you switch back. Keep Begin open until it downloads: reloading or closing the tab stops it. If you log out before then, the file does not arrive and Begin says so: export it again from the report. Keep the downloaded file if you need it again: there is no list of past exports to revisit. The file holds what you are looking at: your own filters, the order you picked on a summary, and the person or row you opened, as the CSV does. It keeps the figures it was built with, so export again after edits or if your access to its people, columns or private leave details changes. If you lose access to policies before opening a generated file that names them, its link no longer opens. Ask your workspace administrator to restore access, or export again with your current permissions.
A grouped report keeps its sections in the generated file. Each opens with a row naming the group, and the column holding that value is left out, exactly as the table on screen drops it under the heading; rows carrying no value sit under Not set. Sections come out in the order sorting the report by that column would put them in, on screen and in the file alike. Sorted up, that is people and positions by name, statuses in the product’s own order and dates oldest first, with the rows holding no value last, together with any whose person or position has since been deleted. Sorted down, the named sections run in reverse, and the deleted and empty ones still come last. A record with several labels sits under each label’s heading, as it does on screen. Remove the heading rows from the data range before sorting or summing.
A summarised report generates too, whatever it is summarised by: one row for each person, position, day, status or other value the report groups by, with the measures the report shows beside it. Each row is named as the table names it, a day is written as a date, and rows with no value sit under Not set. A report whose measures you never chose shows the default ones, and so does its file. A report summarised by person also carries the accounting window as the screen names it, and a report set to show people with nothing in the period keeps their rows. The rows come out in the order the report is sorted in. Where a rule withholds somebody’s figure, the cell says so rather than arriving empty, which a spreadsheet would total as zero. A row that totals several people counts only the people you could see when you asked for the file.
At the summary level, the file includes People, a person summary’s Position, Absences and permitted per-policy days when those columns are shown.
A report grouped or filtered by labels cannot be generated while labels are not available to your workspace, just as the table cannot show it. A Labels column is left out of every file then, as it is left off the screen. If that changes after you ask for the file, the file fails at once and says so, rather than being built without the labels. Remove labels from the report, then export it again.
A report grouped by person draws its people in batches as you scroll. Print / Save as PDF loads the rest before the print dialog opens, so the printed copy holds every person, not only those you scrolled to; a long report shows Loading the whole report for print while it does. The CSV always contains every row too. If a batch fails to load, the table says so under its last row with Try again, and Begin does not print a copy missing those rows: choose Try again at the end of the table, then print again.
Export a day breakdown
Export report as CSV follows the level you are reading. Open a person on a report whose period breaks down by date, and the file holds their days: the same table the screen shows. Open one of those days, or a person on a report with no date breakdown, and it holds their underlying records instead. Return to the summary before downloading everyone’s totals. Export report as Excel follows the same level. Where a file includes both period totals and daily rows, use one level for your spreadsheet sum so you do not count the same hours twice. A day with nothing measured stays empty; it is not replaced with a measured zero. Reading a day breakdown explains how those cells relate to the period total.Handle a large or incomplete report
Each report source can read at most 10,000 source rows. Other processing limits, including the daily calculations needed for many people, can stop a report earlier. Begin refuses a report that exceeds those limits instead of silently exporting a truncated set of records. If the report refuses the download for reaching a processing limit, it says the report is too large to load at once and names the action that helps. Most sources read by date and filter afterwards, so a shorter period helps and an added filter does not. A summary grouped by person checks everyone you can see whatever the dates say, so that one asks you to narrow it to fewer people. A table sorted by person looks up everyone in it, so when it names too many people it asks you to sort by another column or filter to fewer people. A table sorted by a column that cannot be read a page at a time, such as a break column, loads everyone at once, so a very large one asks you to sort by another column or filter to fewer people. People and Leave balances read your whole team whatever the report asks for, so neither helps: contact support. Some report settings read your whole team too, whatever the source: showing a row for every person, sorting by position, or filtering to a department or location that holds a large group. Those answer the same way. A generated file works in smaller pieces before giving up: it halves the period of a list of records, and reads a summary a few people at a time, whatever it is grouped by, so a summary needs no narrowing to fewer people. When a generated file still fails, one day, or one person’s records over the period, is too dense to read at once, and a shorter period helps only if it leaves that out. A file holds the whole report or refuses with the reason, never part of it. An Excel file refuses a cell longer than Excel can hold (32,767 characters) or more rows than one sheet can hold (1,048,576); use Export report as CSV for those. A report whose break columns would need more reading than one export can afford refuses and asks for a shorter period, rather than leaving those cells blank. If records keep changing while an Excel file is built, Begin starts it again once, then refuses and asks you to try again in a moment. A generated file holds about 20 MB at most. A report with many columns over a long period can reach that before any other limit. The export then fails and says so, rather than handing you a file cut short. Remove columns or shorten the period, then export it again. A limit can be reached while the report displays only a few summary rows, because what counts is the records read to build it, not the rows shown. Changing only the grouping does not guarantee that the underlying records fit. A large table downloads in pages, the way the screen loads them as you scroll. Records added to the end of the report while it downloads are included. If records change in a part already downloaded, Begin reads the report again; if they keep changing, the download stops rather than leaving rows out and asks you to try again in a moment. If Begin says figures were still calculating, wait until the report settles and export again. Begin does not download an incomplete file: unfinished hour calculations can look like zeros and unfinished period balances can be absent, but neither is a measured zero. After a Begin update to how hours are calculated, this can happen while the screen still shows the earlier figures.Load the full report
A table or chart too large to load at once loads in full by itself, at the level you are on: the whole report, or the person or group you opened. Begin reads every row in the background, with your current filters and sort, and then shows the report in place of the live one. While it loads, the bar above the table says how far it has got, for example 312 of 1,000 people, with a progress bar and a percentage where the size is already known. You can leave and come back: opening the same report with the same settings within the hour opens the copy already loaded, unless hours in its period have changed since. A copy loaded before a Begin update that changed how loaded reports are stored loads again by itself when you open it. A list that is read day by day appears once every day is in, so its rows never move after you see them. The loaded report keeps the figures it read, so changes made afterwards are not in it. The bar says data as of that time; choose Refresh for a newer copy of the level you are on, or Back to live data to return; the report then offers Load full report rather than loading again by itself. Download CSV and Download Excel on the bar write the loaded report itself, and Print / Save as PDF prints all of it, without the bar or its buttons. One press is enough: the file downloads as soon as it is written, wherever you are in Begin, the same way Export report as Excel does, and a file already written in the same language, under the same report name and with the same columns and headings downloads at once instead of being written again. If you ask for the other format while the first is still on its way, it waits until your browser has taken the first file, or about a minute if that download is blocked, and then downloads too; if you leave the report before the first file arrives, the second is not written, so ask for it again. The report menu writes the loaded report too while you are reading it; on a level that shows live data, it writes that level instead. A colleague whose access matches yours who opens the same report gets the same loaded copy and can write its files too; someone opening it from a link can download a file that is already written. A file is written in the language of the person who asked for it: a colleague reading Begin in another language who downloads it gets it written again in theirs. A shifts report is the exception: it holds the unpublished and open shifts the person who loaded it could see on the schedule. A report loaded by someone who plans the schedule opens only for others who plan it too. Anyone else’s opens for a colleague only if every open shift in it was offered to that colleague as well. Anyone who cannot read it is asked to go back to live data or export the report themselves. The files include its charts, as their rows. If you change what the report reads or how it orders rows, such as a filter, a sort or a newly shown column, the loaded report loads again by itself. Until the new copy is ready, the rows on screen stay dimmed, the row count is hidden, and a download you start is written from the new copy once it lands. Moving, resizing or hiding a column changes nothing that was read, so the copy stays and its files follow the new column order. Opening a different person or group from the loaded report reads their rows live, and the note above the table says so; if they are too large to read live, they load in full the same way. The same note appears when you go back from a person or group that loaded in full to the whole report, which then reads live. Charts in the report show the loaded figures too, and appear once the load has drawn them. While it loads, the bar says how far it has got. A grouped section heading shows a loading bar in place of its count until the final count is known. Every page and chart checks your current access again as you read it, and tells you if your access has changed since. A loaded report is available for seven days. If the full load fails, the bar says why and offers Load again and Back to live data, and the tables and charts below point you to it.The file carries the grid and nothing that talks about it. A CSV with several tables introduces
each with a line holding only the table’s name; remove those lines from the data range before
sorting or summing. A single-table CSV has no such line. A generated XLSX puts each table on its
own tab, named after the table and shortened at a whole word with ”…” when it is longer than Excel
allows. It writes the column headings in bold, each group heading and row count in bold above its
rows, and colours rows by the report’s colour rules, as the screen and a printed copy do. A CSV
cannot carry colour. Everything explaining the figures, the key to the colours included, stays on
screen, in Info.
Next
Checking report totals
Resolve missing or different figures before exporting.
Sharing a report
Give someone access to the report’s current results.
Still need help?
Contact support
Email the Begin team and we’ll get back to you.
Ask Begin AI
Open the AI assistant and get instant answers based on these docs.