


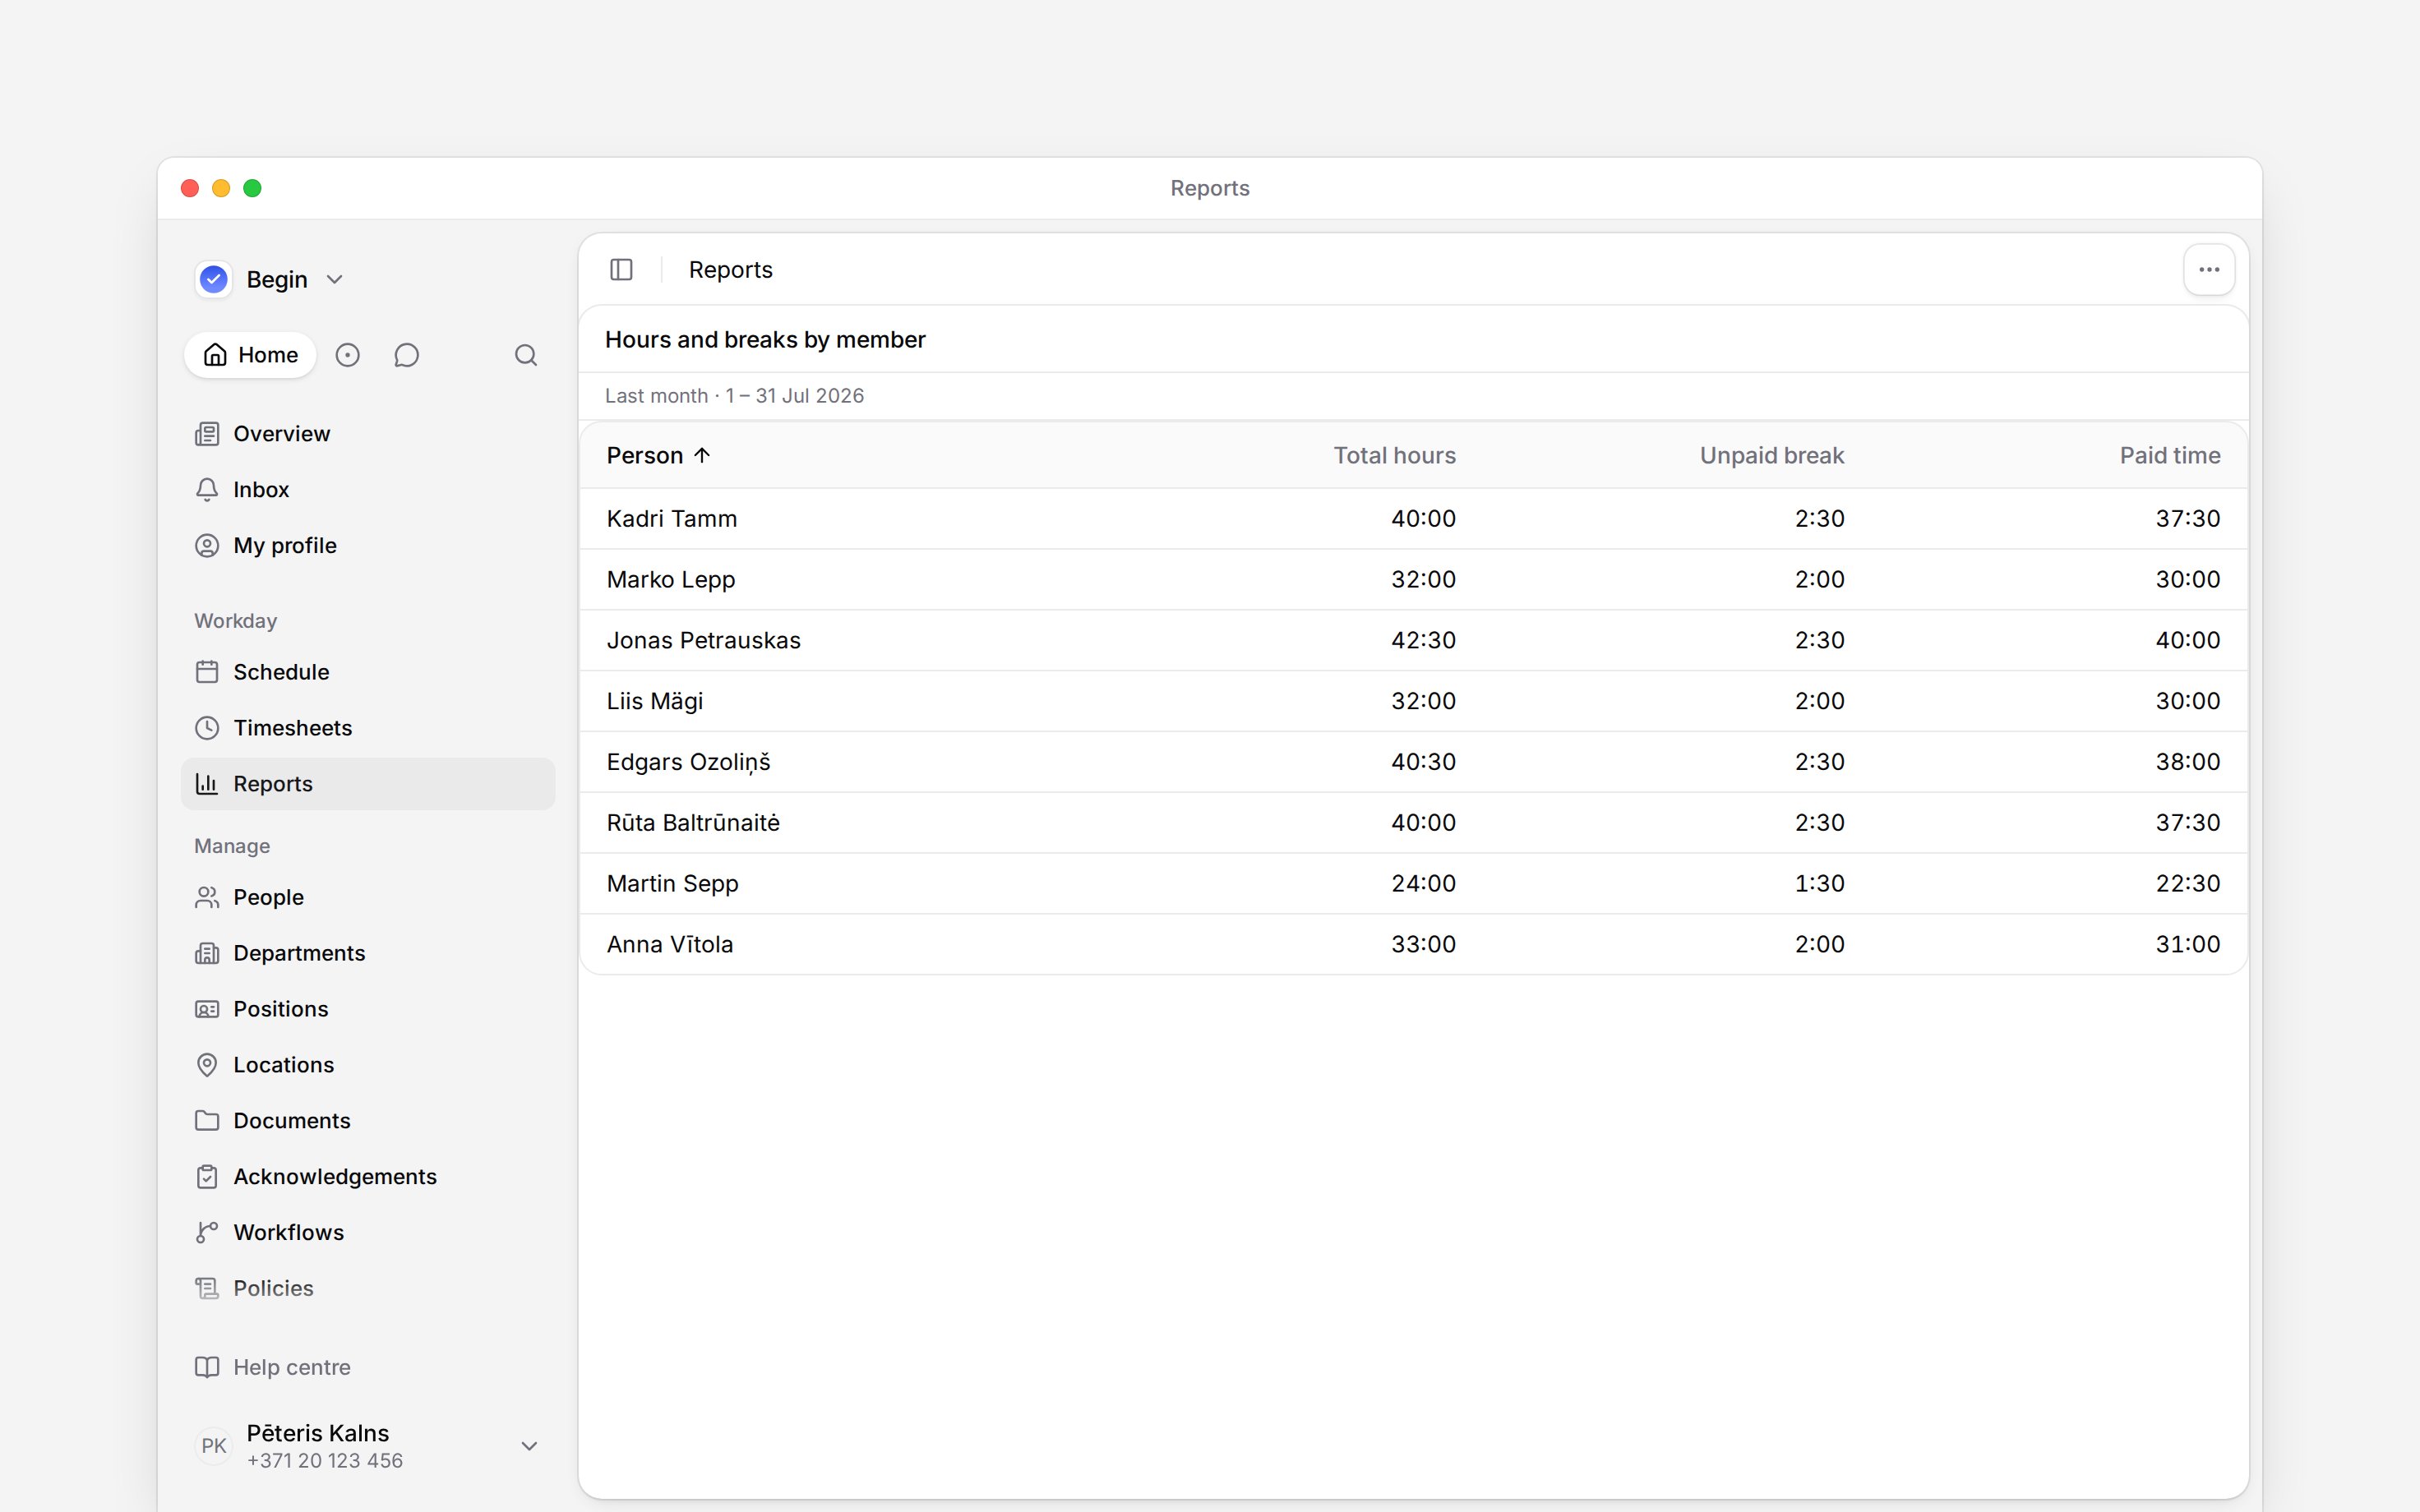
 Hour columns answer different questions. Total hours measures the span of clock records, Reported time takes off every break, and Paid time adds paid breaks back. Choose the figure that matches the job before you compare or download it.
Choose the hours you need
On a person summary, hour totals also reflect the applicable policies and rounding. For a clock record of eight hours with a 30-minute unpaid break and no other adjustments, Total hours is
8:00; Reported time and Paid time are both 7:30.
Read overtime against the norm
Overtime and Undertime are separate positive figures. Overtime/undertime combines them: positive means above the norm, negative means below it. A Shifts report compares scheduled hours with the norm; a Time entries report uses paid time. When overtime is settled over a period, a norm of 160 hours and 168 paid hours gives Overtime of 8 hours, Undertime of zero and Overtime/undertime of +8 hours. At 152 paid hours, the combined figure is −8 hours. Under a daily overtime policy, long days and short days accumulate separately. Both Overtime and Undertime can be positive in the same report; Overtime/undertime is their difference. Do not replace those separate figures with one subtraction from the monthly norm. The person’s contract and working-time rules determine the norm. When contracted hours are missing, Begin can use an assumed full-time norm and marks that assumption on the report. Check the person’s contract before treating that figure as their agreed workload. Norm and overtime are supported for contracts whose country of work is Estonia, Latvia or Lithuania. An unsupported country leaves scheduled and worked hours available. Calculated figures need a summary grouped by Person. If a figure is missing, Checking report totals explains how to read the reason.Check the accounting window
Period overtime, Period undertime and Period overtime balance describe the overtime accounting window. Accounting window names the months it covers. The window can be one month or a longer period set by the person’s overtime policy. Period overtime balance runs from the accounting window’s start through the selected month. Period overtime shows its positive part and Period undertime its negative part as a positive amount. They do not represent separate monthly earnings. For example, balances of +8 hours in January and +12 in February mean the balance through February is +12, not +20. Do not add running balances across monthly exports.Read premium hours
The Incl. columns identify hours in premium windows, such as evening, night, weekend or public-holiday work. They are portions of the hours already measured, not extra hours to add to Paid time. A (total) column includes public-holiday hours; its plain counterpart excludes them. The matching Incl. holiday column shows the holiday part. These calculated classifications appear on person summaries and their day breakdowns, not on individual records.Next
Checking report totals
Find why a figure is unavailable or differs from the records.
Downloading a report
Choose decimal hours before spreadsheet calculations.
Still need help?
Contact support
Email the Begin team and we’ll get back to you.
Ask Begin AI
Open the AI assistant and get instant answers based on these docs.